
Cleora: recommendations without a language model
“Similar products” and “customers also bought” can be computed without a language model. All it takes is a purchase history turned into a graph, meaning a network of links, and an algorithm that turns that graph into numbers. Cleora, an open-source project from a Polish team, does it on an ordinary processor. Below are the numbers its authors published, and the places where the method fails.
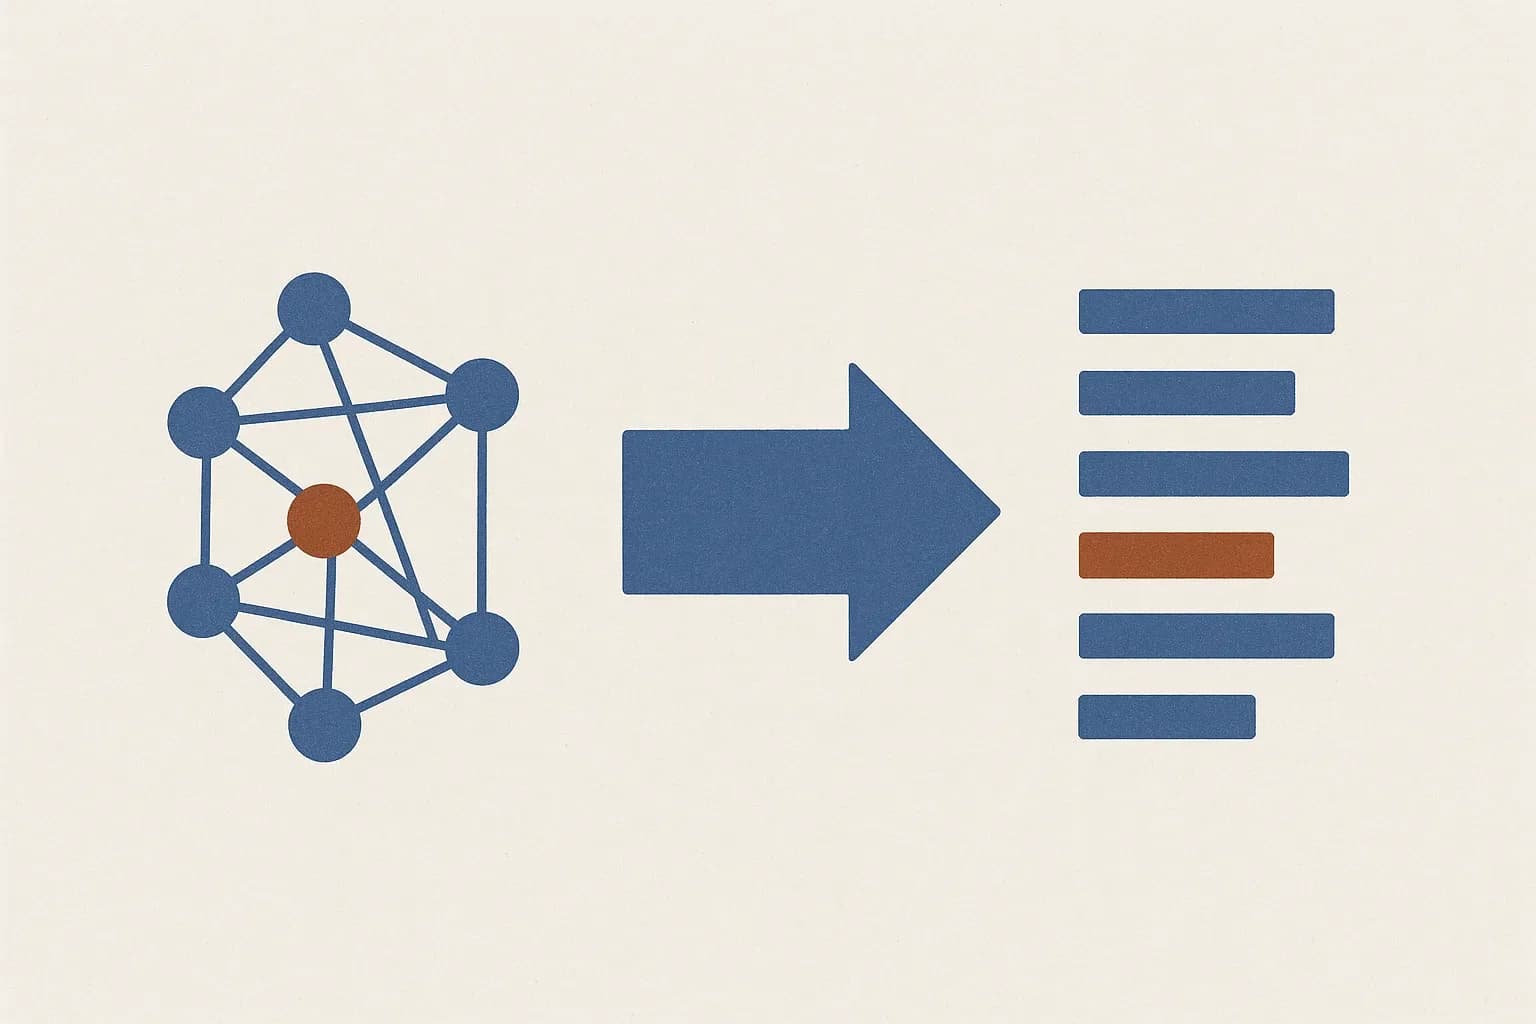
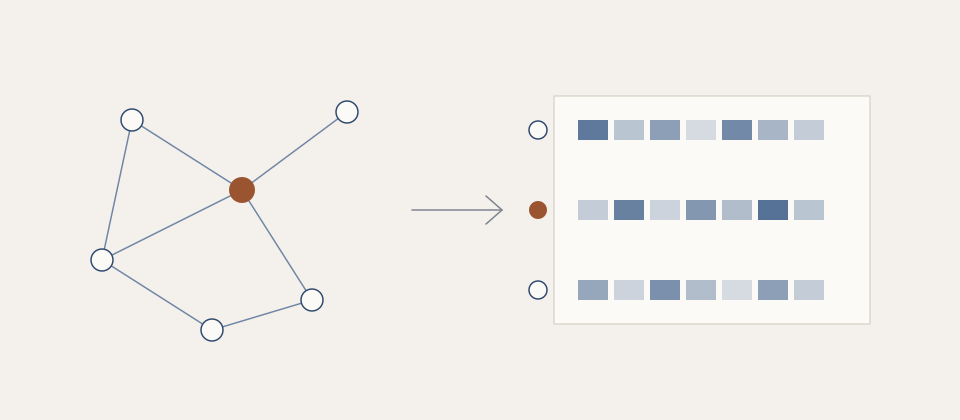
Your customers’ behaviour forms a graph on its own. A customer links to a product they bought, the product links to a category, one basket links to another. Nobody designs this, it is simply a record of what happened in the shop. An embedding turns such an object into a row of numbers, usually a few hundred of them, arranged so that objects with similar histories get similar rows. Once you have those rows, the question “what is similar to this product” stops being a research problem and becomes an ordinary nearest-neighbour lookup in a database.
What Cleora is and who built it
Cleora was described in February 2021 by Barbara Rychalska, Piotr Bąbel, Konrad Gołuchowski, Andrzej Michałowski and Jacek Dąbrowski, working at the Polish company Synerise and, in part, at the Warsaw University of Technology. The code has been open from the start under the MIT licence, which permits commercial use. The repository is now run by BaseModelAI and the library installs with a single command as pycleora. Its latest release on PyPI is dated 2 April 2026, so the project has not been abandoned.
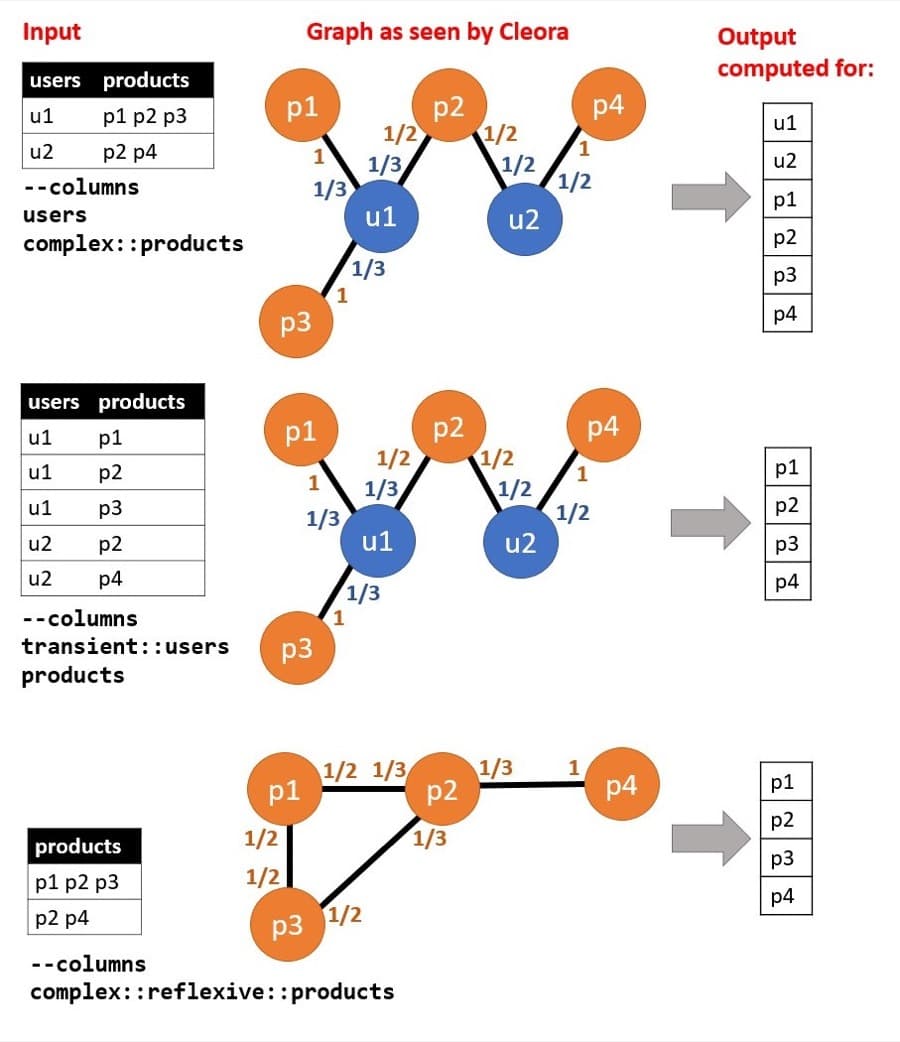
The idea itself is surprisingly plain. Every node in the graph starts with a row of numbers, then repeatedly replaces it with the averaged row of its neighbours and normalises the result. There is no objective function, no sampling of positive and negative examples, no graphics card. The authors note that the algorithm has only two settings, the number of passes and the length of the row, while the competing PyTorch BigGraph has at least eighteen. That simplicity is why the numbers below look the way they do.
The numbers the authors published
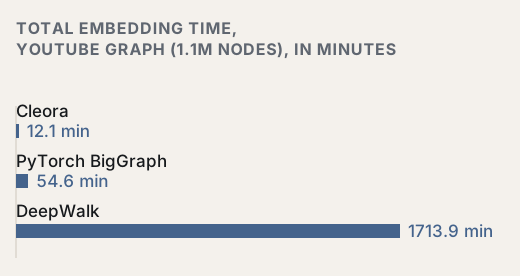
In the 2021 paper the authors timed five public graphs. Take the YouTube graph: 1,134,890 nodes and 2,987,624 edges. Computing the embeddings took Cleora 12 minutes and 7 seconds. PyTorch BigGraph, the scalable engine from Facebook’s research lab, needed 54 minutes and 35 seconds. DeepWalk, a classic graph method, ran for 28 hours and 33 minutes. All of it on one Azure machine, a Standard E32s v3 with 32 virtual cores and 256 GB of memory.
On bigger graphs the gap widens. LiveJournal, 4,847,571 nodes and just under 69 million edges: Cleora 1 hour 36 minutes, PyTorch BigGraph 10 hours 38 minutes, DeepWalk never finished. On the Twitter graph, 41.65 million nodes and 1.47 billion edges, the only method that reached the end was Cleora, in 25 hours and 34 minutes. The others stopped on excessive resource consumption. The authors add that in their own production environment their largest e-commerce datasets embedded in under two hours on the same machine.
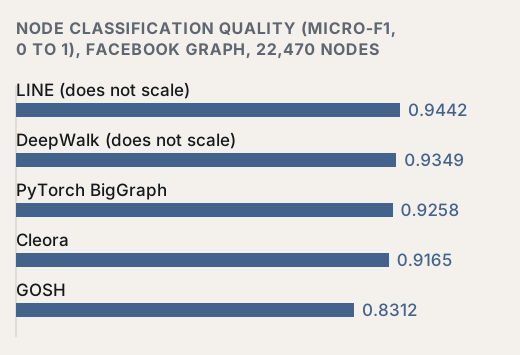
Quality is a different story and worth reading closely. On the task of assigning nodes to categories on the Facebook graph, 22,470 nodes, Cleora scored a micro‑F1, meaning a measure of accuracy, of 0.9165. That is fourth out of five. LINE (0.9442), DeepWalk (0.9349) and PyTorch BigGraph (0.9258) all did better. The catch is that the authors themselves classed the first two as non-scalable: on larger graphs they simply never finish. Only GOSH, a method that runs on a graphics card, scored lower. Cleora does not win on quality. It wins by delivering a result at sizes where the others give up.
Where this beats a language model
A language model has no advantage here, because there is nothing for it to read. The fact that two products go together does not live in their descriptions, it lives in a thousand people having bought them together. Then there is the bill. Say you show a “similar products” panel on 100,000 page views a day, and one request to the model carries 2,000 input tokens, meaning pieces of text. That is an assumption, not a measurement. It comes to 200 million tokens a day. In Anthropic’s public price list the cheapest model, Claude Haiku 4.5, costs 1 dollar per million input tokens, so the inputs alone are 200 dollars a day, roughly 6,000 dollars a month, before counting the replies.
On the embedding side there is no per-request charge at all. The rows of numbers are computed in advance, and answering is a database lookup, so the delay is whatever your database already takes. For scale: in the benchmark on the project’s own site, the California road network graph, 1,965,206 nodes, was embedded in 31.5 seconds on a single shared core.
Where the method fails
The biggest hole is wherever there is no history. Cleora reads graph structure and nothing else, so a product added to the catalogue today has nothing from which to get a row of numbers. The team at Zomato, a food ordering platform, said so plainly in April 2022: unlike GraphSAGE, meaning a graph neural network, Cleora could not be given product features at the time, and edge weights were not implemented. That same post is also the most repeated argument in Cleora’s favour: embeddings for one region of India took under 5 minutes instead of the roughly 20 hours GraphSAGE needed.
- Cold start. A new product with not one purchase behind it does not exist in the graph, so there is no vector for it.
- Dominant entities. The project’s documentation warns that an object present in almost every basket, a carrier bag for instance, degrades the results and is better removed from the input.
- Adding nodes after the fact. The authors tested this in a separate experiment where only 30 per cent of nodes are learned directly and the baseline is 0.9190: when the other 70 per cent are added after the rest have been computed, accuracy on the Facebook graph drops to 0.8718, and to 0.7856 at the second level of reconstruction. On the YouTube graph the drops are 18 and 40 per cent.
- Mixing types. The documentation states outright that comparing a customer vector with a product vector is methodologically wrong. You compute products first, then build customers out of them.
How it combines with a language model
The two worlds do not exclude each other. Cleora’s documentation explicitly describes starting from rows of numbers produced by a model that reads text or an image, and only then running the averaging across the graph. That is a ready answer to cold start: a new product enters with a vector from its description and photo, and the purchase history improves it later. The authors went further and in 2020 published EMDE, a layer that turns product vectors plus a customer’s purchase list into one compact representation of that customer. Zomato built its recommendations on the pair of Cleora and EMDE and reports Recall@Top10, meaning hits in the first ten, of 35 per cent, while noting that the figure says little on its own without measures of diversity. In that arrangement the graph answers “what to show”, and the language model at most answers “how to write about it”.
What these numbers do not promise
The measurements in the paper are from February 2021 and compare Cleora with what counted as scalable then: PyTorch BigGraph, GOSH, DeepWalk and LINE. Both the hardware and the competition have changed since. A newer benchmark on the project’s site puts Cleora first on all five datasets, but the methodology is worth reading. Everything ran on a single shared core with about 3 GB of memory and a 90 second limit per result, the competitors were given default settings with no tuning, and the page’s own authors concede that on a larger machine some of them would have finished. This is a vendor benchmark, not an independent test.
There is one more thing that is easy to miss and that changes everything in a shop: the number of passes changes what the result means. At one pass, a product’s nearest neighbours are the things bought alongside it; at four, they are the things that could replace it. The authors showed this on Dunnhumby data covering 2,500 households over two years. It is a single setting, it answers two completely different business questions, and it is easy to set the opposite way to the one you wanted.
If you have a catalogue and a transaction history, this test is cheap: one file of customer and product pairs, one computation, and a comparison against what you show today. If you would like to try it on your own data, write to us.
Sources
- 01Rychalska et al., Cleora: A Simple, Strong and Scalable Graph Embedding Scheme, arXiv 2102.02302
- 02BaseModelAI/cleora, GitHub repository
- 03Cleora, Benchmark Results and Methodology
- 04Zomato Data Science Team, Connecting the Dots: strengthening recommendations for our customers (Part Two), April 2022
- 05Dabrowski et al., An efficient manifold density estimator for all recommendation systems, arXiv 2006.01894
- 06Anthropic, Claude API pricing